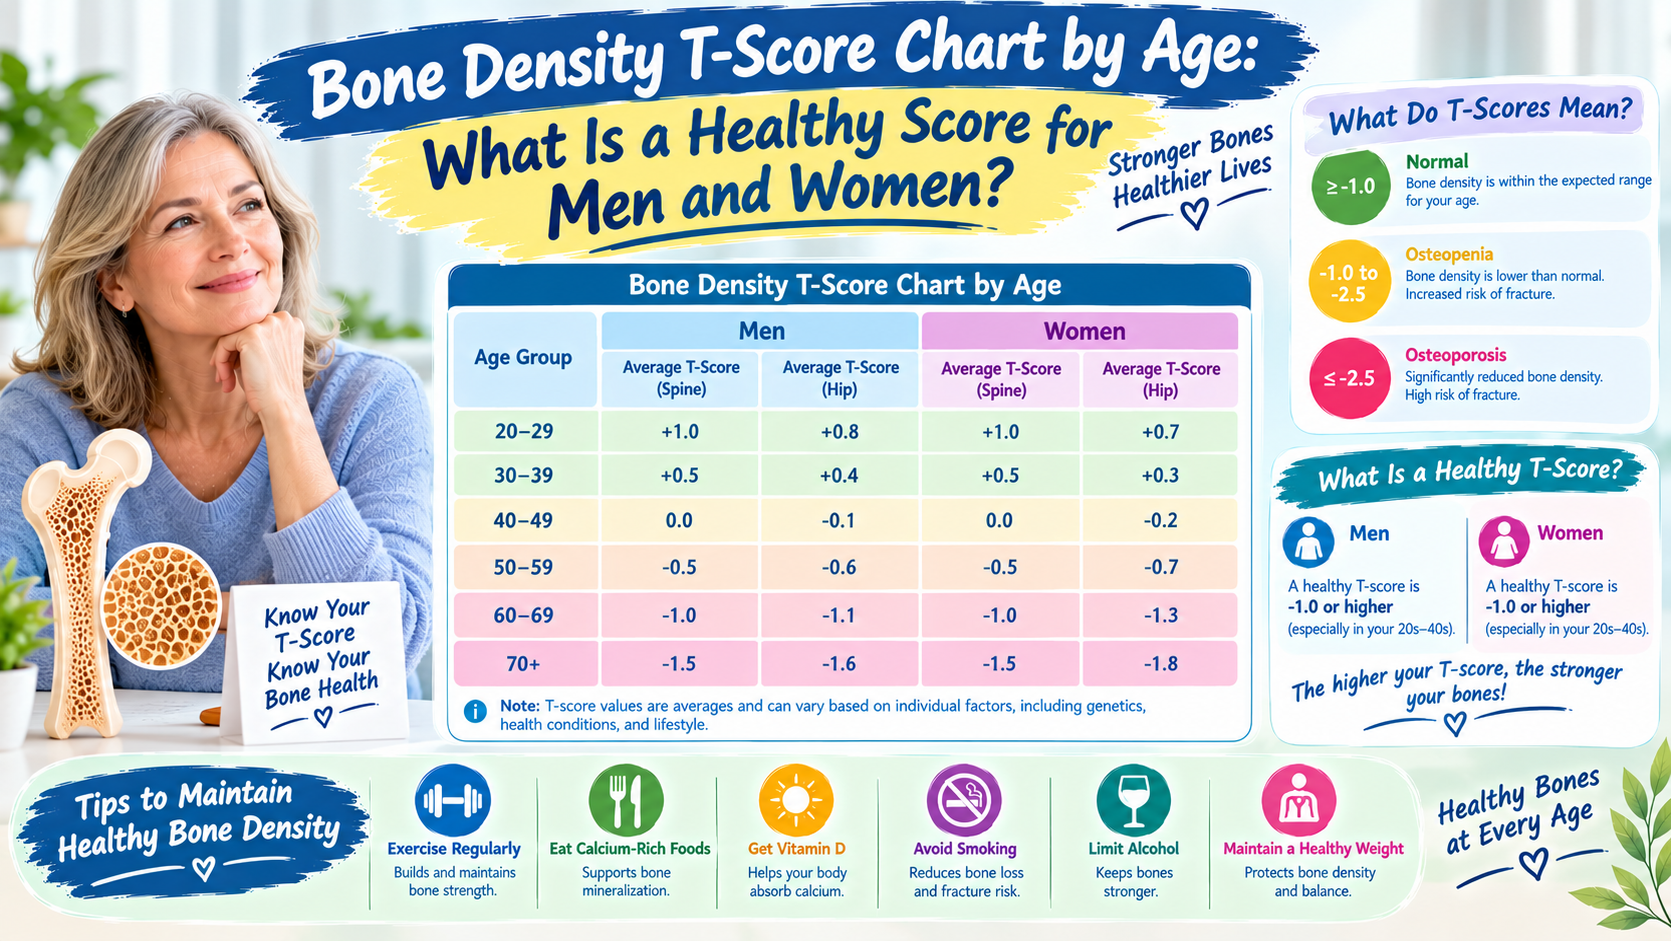
Bone density is an important indicator of bone health, particularly as people get older. Strong bones help support the body, protect vital organs, and reduce the risk of fractures. However, bone density can decrease with age, hormonal changes, certain medical conditions, and lifestyle factors.
A bone density T-score chart helps explain the results of a bone density test and whether a person’s bone mineral density falls within the normal range, the low bone mass range, or the osteoporosis range.
But what is a healthy bone density T-score for men and women at different ages? Does a healthy score change after age 50, 60, or 70?
This guide explains how to read a bone density T-score chart, how results are interpreted in men and women, and what you can do to support stronger bones.
What Is a Bone Density T-Score?
Click Here To Watch Video to Treat Osteoporosis Disease Naturally!..
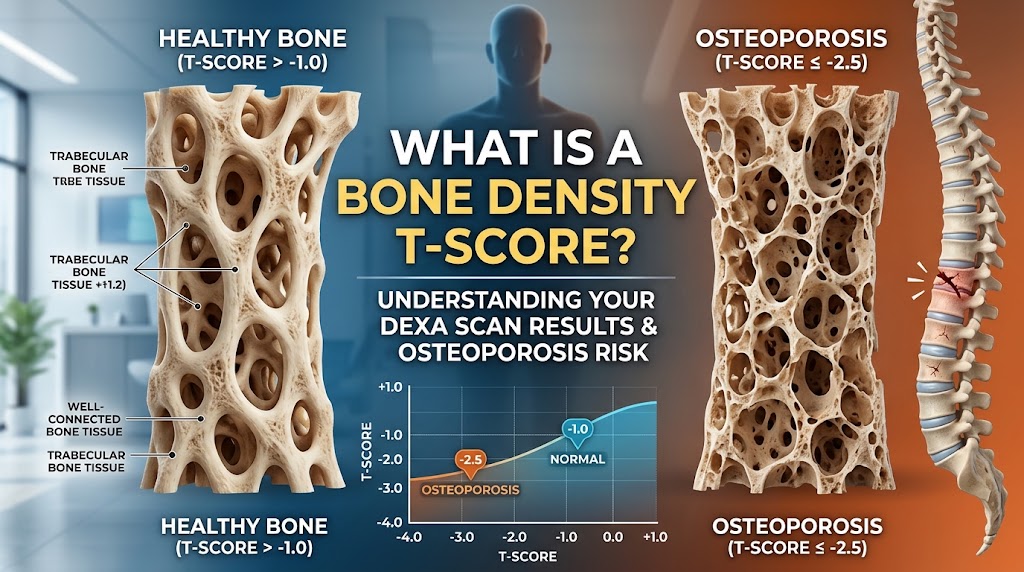
A bone density T-score is a measurement obtained from a bone mineral density test, usually performed using dual-energy X-ray absorptiometry, commonly called a DXA or DEXA scan.
The score compares your bone mineral density with that of a healthy young adult reference population. It is expressed in standard deviations (SD), indicating how far your result is above or below the reference average.
A score closer to zero or above zero generally indicates higher bone mineral density than a more negative score. A lower score can indicate weaker bones and a greater risk of fractures.
According to the International Society for Clinical Densitometry (ISCD), T-scores are generally used to classify bone density in postmenopausal women and men aged 50 and older. Younger adults are usually assessed using Z-scores instead.
Bone Density T-Score Chart for Men and Women
The following chart shows the standard T-score categories used to interpret bone density results in postmenopausal women and men aged 50 and older.
| T-score range | Bone density category | What it means |
|---|---|---|
| -1.0 and above | Normal | Bone density is within the normal range |
| Below -1.0 but above -2.5 | Low bone mass (osteopenia) | Bone density is lower than normal |
| -2.5 and below | Osteoporosis | Bone density is low enough to meet the densitometric criterion for osteoporosis |
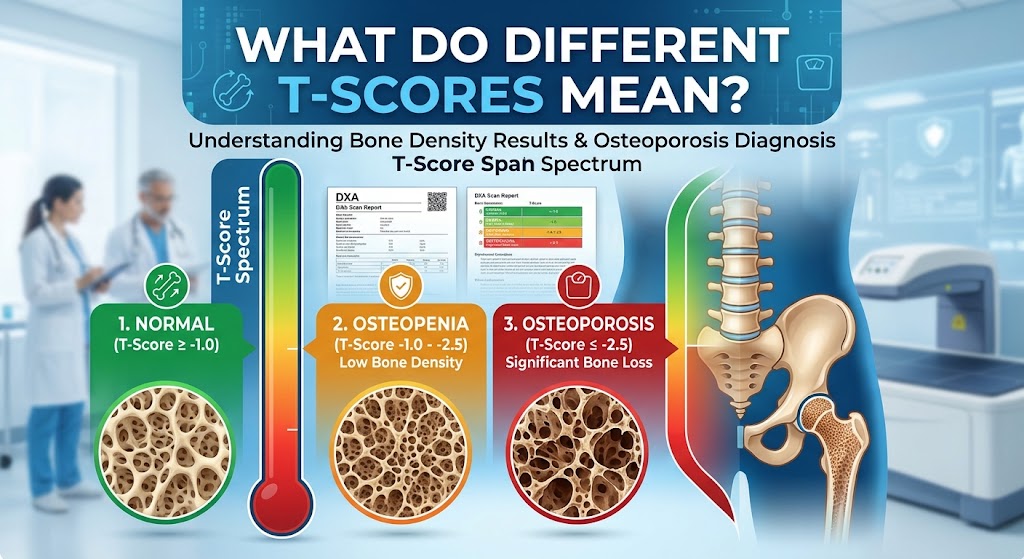
These thresholds are used for both men and women in the appropriate age and hormonal groups. A T-score of -1.0 is considered normal, while a score of -2.5 or lower falls within the osteoporosis range.
Important: A T-score does not provide a complete picture of fracture risk. Your medical history, previous fractures, medications, age, and other risk factors also matter.
Bone Density T-Score Chart by Age
Many people search for a bone density chart by age because bone density often changes over time. However, there is no single T-score that is considered healthy for every age group.
For postmenopausal women and men aged 50 and older, the same standard T-score categories generally apply across the age range. The difference is that the likelihood of fractures and the need for screening or treatment may increase with age.
| Age group | How bone density is generally assessed | What to know |
|---|---|---|
| Under 30 | T-score is not usually the primary measure for younger people | Bone development and peak bone mass are important |
| Ages 30–49 | Assessment depends on sex, menopausal status, and clinical circumstances | Z-scores are generally preferred for premenopausal women and men under 50 |
| Ages 50–59 | T-scores are generally used for postmenopausal women and men aged 50+ | Results should be interpreted with fracture risk factors |
| Ages 60–69 | T-score categories remain the same for appropriate groups | Screening and treatment decisions depend on individual risk |
| Ages 70–79 | T-score categories remain the same | Falls, previous fractures, and other health conditions become especially important |
| Ages 80+ | T-score categories remain the same | Overall health, mobility, and fracture prevention are important considerations |
This is a guide to assessment, not a chart of expected scores for each age. A T-score of -1.5, for example, falls in the low bone mass range whether the person is 55 or 75, assuming T-score classification is appropriate.
What Is a Healthy Bone Density T-Score for Women?
Click Here To Watch Video to Treat Osteoporosis Disease Naturally!..
The interpretation of bone density results in women depends partly on whether they have gone through menopause.
Premenopausal women
For women who have not reached menopause, a Z-score is generally preferred rather than a T-score. A Z-score compares bone density with what is expected in people of a similar age.
A Z-score above -2.0 is considered within the expected range for age, while a Z-score of -2.0 or lower is described as below the expected range for age.
A low Z-score does not automatically establish a diagnosis of osteoporosis. Healthcare professionals may investigate other factors, such as nutritional deficiencies, medications, hormonal conditions, or underlying illnesses.
Postmenopausal women
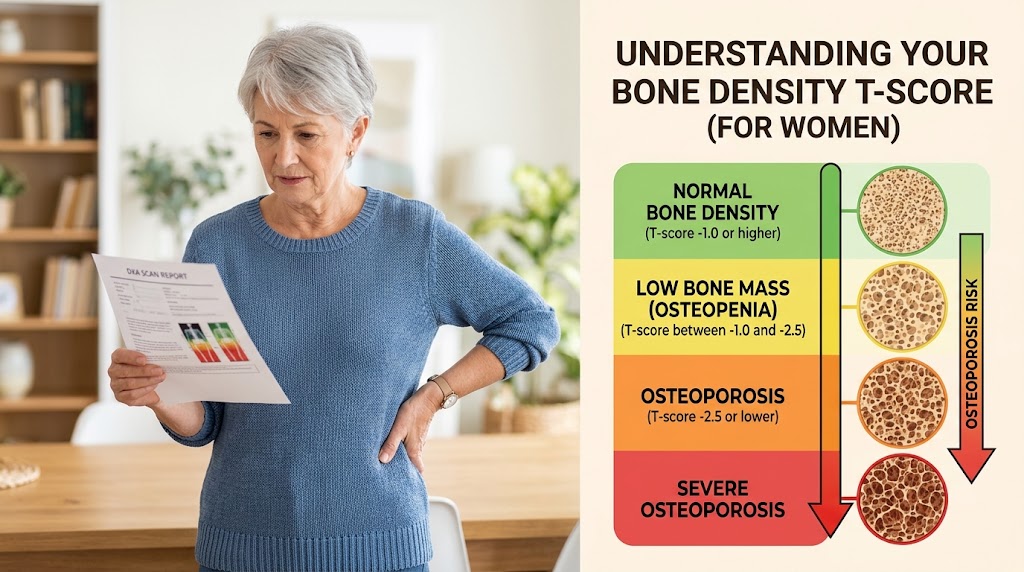
After menopause, T-scores are generally used to classify bone density.
- T-score of -1.0 or higher: Normal bone density.
- T-score between -1.0 and -2.5: Low bone mass, also called osteopenia.
- T-score of -2.5 or lower: Meets the bone-density criterion for osteoporosis.
Estrogen levels decline during menopause, which can accelerate bone loss in some women. However, the extent of bone loss varies, and not every postmenopausal woman develops osteoporosis.
Women should discuss bone density screening with their healthcare professional, particularly if they have additional risk factors or a history of fractures.
What Is a Healthy Bone Density T-Score for Men?
Click Here To Watch Video to Treat Osteoporosis Disease Naturally!..
Men can also develop low bone density and osteoporosis. Although bone loss often becomes more common with age, it can occur earlier because of certain diseases, medications, hormonal problems, or lifestyle factors.
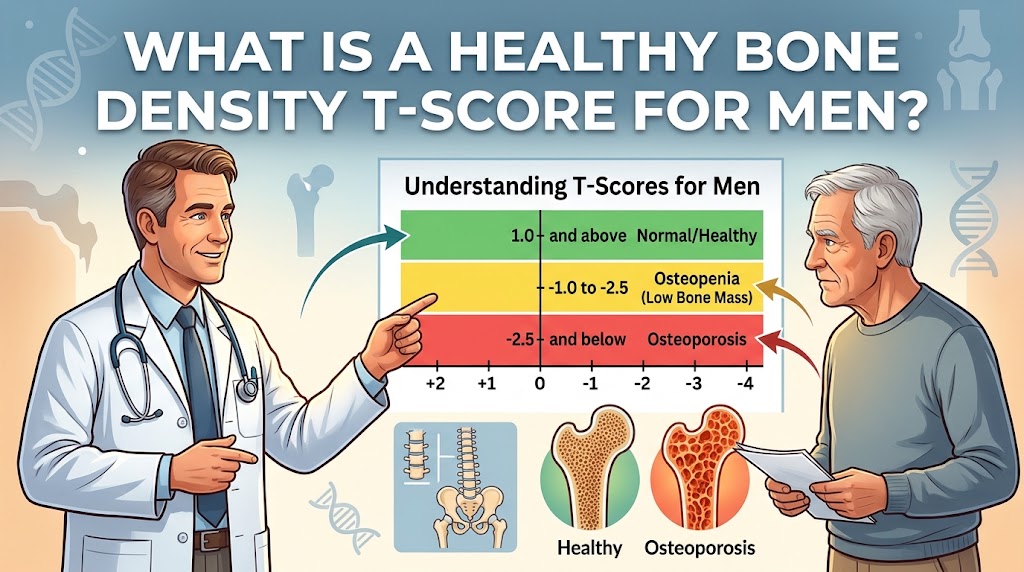
For men aged 50 and older, the standard T-score categories are generally the same as those used for postmenopausal women.
For example:
- A T-score of 0.0 indicates bone density equal to the reference average.
- A T-score of -0.8 falls within the normal range.
- A T-score of -1.7 falls within the low bone mass range.
- A T-score of -2.6 falls within the osteoporosis range.
For men younger than 50, Z-scores are generally preferred. Osteoporosis should not be diagnosed in men under 50 based on bone density alone; other clinical information is needed.
Men should not assume that osteoporosis is only a concern for women. Older men, especially those with previous fractures or certain medical conditions, may benefit from bone health evaluation.
What Do Different T-Scores Mean?
Click Here To Watch Video to Treat Osteoporosis Disease Naturally!..
Understanding a few example scores can make a bone density report easier to interpret.
T-score of 0.0
A score of 0.0 means the measured bone density is equal to the young-adult reference average. It is within the normal range.
T-score of -0.5
This score is still within the normal range. It indicates bone density below the reference average but not low enough to meet the threshold for low bone mass.
T-score of -1.5
This score falls within the low bone mass range. It does not automatically mean that a fracture will occur or that medication is necessary. A clinician considers the person’s overall fracture risk.
T-score of -2.5
This score reaches the standard threshold for osteoporosis when measured at an appropriate site in a person for whom T-score classification applies.
T-score of -3.0
This score is within the osteoporosis range and indicates substantially reduced bone density compared with the reference population. The healthcare professional should assess fracture risk and determine whether treatment is appropriate.
A lower T-score generally corresponds to a higher fracture risk, but the number should never be interpreted in isolation.
What Is the Difference Between a T-Score and a Z-Score?
T-scores and Z-scores both describe bone density, but they compare results with different reference groups.
| Feature | T-score | Z-score |
|---|---|---|
| Comparison | Healthy young-adult reference population | People of similar age |
| Common use | Postmenopausal women and men aged 50+ | Premenopausal women and men under 50 |
| Main purpose | Classifies bone density using standard diagnostic categories | Helps assess whether bone density is unusual for age |
| Low result | -2.5 or lower meets the densitometric osteoporosis threshold in appropriate groups | -2.0 or lower is below the expected range for age |
A Z-score is especially useful when assessing younger adults because a person’s bone density should be interpreted in relation to age and clinical circumstances.
If you are unsure which score appears on your report, ask your healthcare professional to explain which measurement is appropriate for your age and medical history.
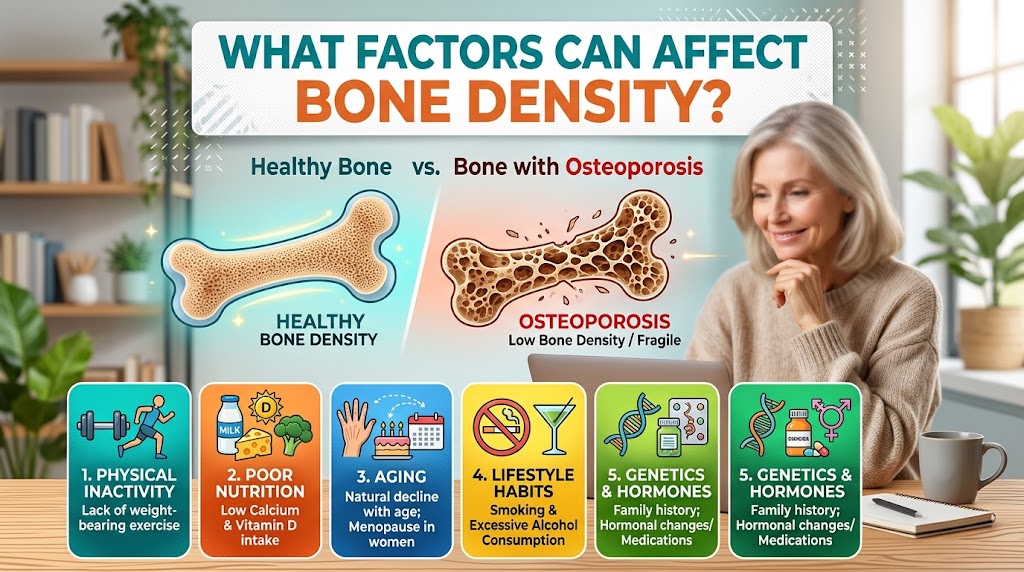
What Factors Can Affect Bone Density?
Click Here To Watch Video to Treat Osteoporosis Disease Naturally!..
Several factors can influence bone density and the risk of developing osteoporosis.
1. Age: Bone density commonly reaches its peak in early adulthood and may decline later in life.
2. Menopause and hormones: Reduced estrogen after menopause can accelerate bone loss. Low testosterone and other hormonal disorders can also affect bone health.
3. Family history: A family history of osteoporosis or hip fractures may increase risk.
4. Nutrition: Inadequate calcium, vitamin D, protein, or overall food intake can affect bone health.
5. Physical inactivity: Bones benefit from weight-bearing activities and appropriate resistance exercise.
6. Smoking: Tobacco use is associated with poorer bone health.
7. Excessive alcohol: Heavy alcohol consumption can increase fracture risk and negatively affect bone health.
8. Medical conditions and medications: Certain digestive disorders, endocrine conditions, and long-term use of some medications, including glucocorticoids, may contribute to bone loss.
Identifying these factors can help healthcare professionals decide whether testing or preventive measures are appropriate.
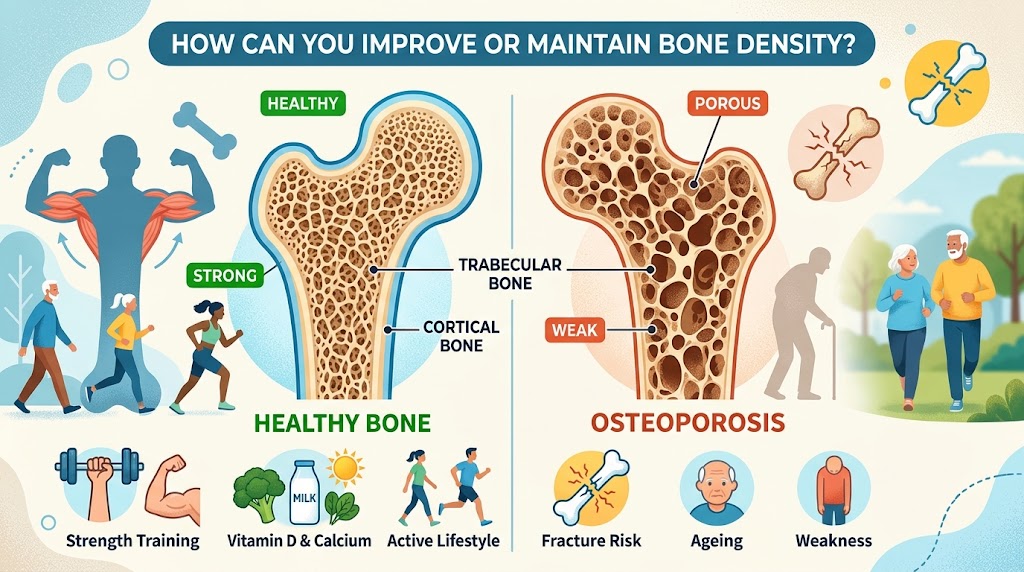
How Can You Improve or Maintain Bone Density?
Click Here To Watch Video to Treat Osteoporosis Disease Naturally!..
Although age-related bone changes cannot always be prevented, several habits can help support bone health.
Eat calcium-rich foods
Calcium is essential for maintaining bones. Sources include milk, yogurt, cheese, calcium-fortified foods, and some leafy green vegetables.
The amount you need depends on your age, diet, and health circumstances. Ask a healthcare professional whether supplements are necessary before starting them.
Get enough vitamin D
Vitamin D helps the body absorb calcium. Sunlight exposure, certain foods, and supplements can contribute to vitamin D intake. People with deficiency or conditions affecting absorption may need individual advice.
Exercise regularly
Weight-bearing activities, such as walking, and resistance exercises can help support bone and muscle strength. Choose activities that match your fitness and balance abilities.
If you have osteoporosis, a previous fracture, or significant balance problems, ask a healthcare professional or physiotherapist which exercises are safe for you.
Avoid smoking and limit excessive alcohol
Stopping smoking and avoiding heavy alcohol consumption can support overall health and may reduce some bone-related risks.
Prevent falls
Good lighting, secure footwear, clear walkways, and suitable handrails can reduce fall hazards. Balance and strength exercises may also help when appropriate.
Follow medical advice
If you have osteoporosis or a high risk of fracture, lifestyle changes alone may not be sufficient. Your healthcare professional can discuss whether medication or additional testing is appropriate.
When Should You Get a Bone Density Test?
A DXA scan may be recommended based on age, menopausal status, fracture history, medical conditions, and other risk factors.
In the United States, the US Preventive Services Task Force recommends osteoporosis screening for women aged 65 and older and for postmenopausal women younger than 65 who are at increased risk. It has found insufficient evidence to make a population-wide recommendation for screening men, so clinical judgment is important. Other professional organizations may use different screening recommendations for men.
Your clinician may recommend testing earlier if you have a fragility fracture, take medications that affect bone health, or have a condition associated with bone loss.
The timing of repeat scans depends on your initial result, risk factors, and whether treatment has started. Not everyone needs a scan every year.
Final Thoughts
A bone density T-score chart can help men and women understand whether their bone density falls within the normal, low bone mass, or osteoporosis range.
For postmenopausal women and men aged 50 and older, a T-score of -1.0 or higher is considered normal, a score below -1.0 but above -2.5 indicates low bone mass, and a score of -2.5 or lower falls within the osteoporosis range.
These categories do not change simply because a person is older. However, age, previous fractures, medical conditions, and other risk factors affect the likelihood of future fractures and the need for treatment.
For younger adults, a Z-score is generally more appropriate. The best way to understand your results is to review the full report with a qualified healthcare professional and develop a plan based on your individual needs.
Medical disclaimer: This article is for educational purposes only and is not a substitute for professional medical advice, diagnosis, or treatment. Consult a qualified healthcare professional to interpret your bone density results and discuss screening, fracture risk, and treatment options.